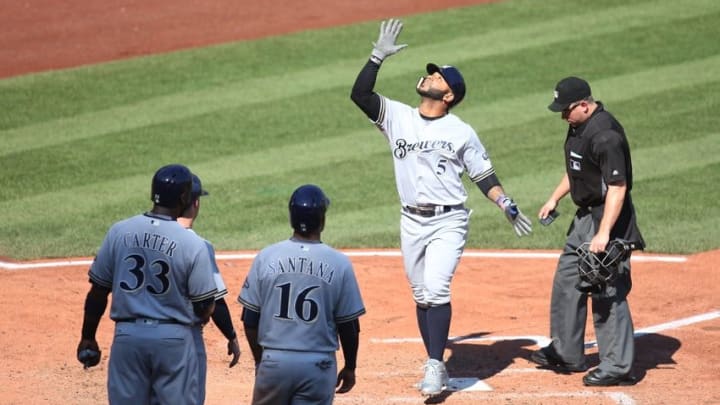
Jonathan Villar‘s batting average has taken a hit over the last few months for the Milwaukee Brewers, and that’s OK. Let’s take a look at why.
Jonathan Villar hit .298 in the first half of the season. Couple that with his on-base skills, and the Milwaukee Brewers had a lead-off hitter reaching base 38% of the time.
It was a great start to the year, but it should have come with some warning signs. Or one, specifically. Villar’s batting average on balls in play (BABIP) was a sky-high .410 during that time.
For reference, the highest qualified BABIP in 2016 belongs to DJ LeMahieu at .389, while Villar sits at fourth, with a .379 BABIP. Before we get more into that, let’s run through BABIP one more time. For starters, the league average for BABIP hovers around .300.
More from Brewers News
- Brewers: 4 Players Who Must Step Up for the Crew to Make the Playoffs
- Brewers: Yet Another Huge Promotion For Top Prospect Jackson Chourio
- Brewers Making Colossal Mistake With Corbin Burnes’ Contract
- Which Players May Be In The Final Month Of Their Brewers Careers?
- Brewers: Where Does Devin Williams Stand In NL Reliever Of The Year Race?
Deviations in BABIP are based on many things, including luck. Many top hitters remain well above the .300 average for their careers because they have the ability to hit the ball harder than average. Additionally, players who are fast will have elevated infield hit numbers, and thus, a better chance at higher BABIPs. Mike Trout‘s career BABIP is .360, Ryan Braun‘s is .334, and Villar’s is .349.
If any player’s batting average is unusually high, check their BABIP. If their BABIP is inflated, prepare for that player to regress. For example, former Braves third baseman Chris Johnson hit .321 with a .394 BABIP in 2013.
Despite having a high career BABIP (.353), his inflated BABIP should have tipped off the Braves. Instead, Atlanta signed Johnson to an extension, and he hit .263 in 2013. Johnson was dumped by the Braves via trade in 2015.
A very similar thing happened with Dexter Fowler in Colorado. He seemed to have broken through as an elite hitter in 2012, hitting .300 (.390 BABIP), only to hit .263 (.323 BABIP) the following year.
The same applies to players with suppressed batting averages and BABIPs. Expect them to regress to their career average.
(If you want an undoubtedly better rundown of BABIP, check here.)
Hopefully, now it is apparent why Villar’s early batting average was not indicative of his actual batting profile. Even as a hitter who has lived well above the league average BABIP, Villar’s first-half .410 mark was unsustainable.
More from Reviewing the Brew
- Brewers: 4 Players Who Must Step Up for the Crew to Make the Playoffs
- Brewers: Yet Another Huge Promotion For Top Prospect Jackson Chourio
- Brewers Making Colossal Mistake With Corbin Burnes’ Contract
- Which Players May Be In The Final Month Of Their Brewers Careers?
- Brewers: Where Does Devin Williams Stand In NL Reliever Of The Year Race?
So what is Villar’s second half BABIP? It’s .336, which to most hitters would be well above average, but for Villar appears to be unlucky. Subsequently, Villar’s second half batting average is .269, a clear departure from his high-average first half. And yet, Villar’s OPS has risen in the second half, .827, versus .806 in the first.
This is due to a massive second half power surge, with Villar hitting home runs more than twice as often as in the first. Additionally, he has hit doubles and triples at a similar rate to the first half.
Villar’s hard hit percentage has jumped from 32.3% in the first half to 38.7% in the second, while his percentage of softly hit balls has dropped from 23.5% to 17.8%. His medium hit percentage has remained around 44%.
Not only is Villar hitting the ball harder more often, and hitting home runs more often, he’s also popping out far less often. Infield fly balls are in line with strikeouts regarding offensive liability, and Villar popped out a lot in the first half. Third most in the Majors to be exact (19.0% of his flyballs).
In the second half, however, that number is just 7.3%, or 103rd most in the Majors. That is a remarkable turnaround in one of Villar’s weakest areas.
So Villar has improved in numerous areas and maintained his OPS while losing potential hits to a regressed BABIP.
But Villar’s improvements aren’t limited to his plate production. Despite fewer potential chances to steal in the second half, Villar has stolen nearly as many bases as in the first half (31 vs. 25) while bumping his steal rate from 76% to 81%.
While it’s possible that Villar has just run on worse catchers in the latter half of the season, the idea that he may be improving his awareness on the base paths is exciting.
So don’t fret Villar’s .185 average in September. It’s largely due to an incredibly unlucky .161 BABIP, and he still has a .790 OPS this month.
Next: Carter One of the Hardest Hitting Milwaukee Brewers Ever
Despite positional questions, Villar looks the part as one of the Milwaukee Brewers building blocks going forward, and his energetic style of play is likely to excite (and anger) fans for the foreseeable future.
All statistics courtesy of FanGraphs compiled 9:00 p.m. 9/19/2016.
