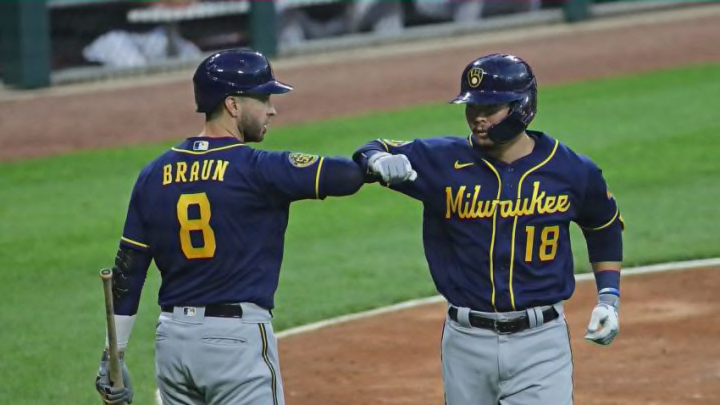
After a strong rookie campaign, Keston Hiura struggled in his sophomore season. Is he primed for a bounceback campaign for the Brewers in 2021?
Keston Hiura broke into the Majors in 2019 and lit the world on fire. He slashed .303/.368/.570 as a Rookie, he whacked 19 home runs, and had a wRC+ of 139. Hiura’s BABIP of .402 was exceptionally high, which made him a likely regression candidate for the Brewers going into 2020.
2020 was a difficult season for Keston Hiura. He struggled, slashing .212/.297/.410, with 13 home runs and an 87 wRC+ in the abbreviated season. He appeared in 49 games at second, and spent 10 games as DH.
Which Keston Hiura will we see in 2021?
Offense
One of the largest indicators of a possible regression for Hiura was his BABIP. While there is no exact measure of BABIP, typically league average hovers around .300. In 2019, Hiura had a BABIP of .402. In 2020, Hiura had a BABIP of .273.
Hiura’s 2019 BABIP was the third-highest in MLB, with a minimum of 300 PA. In 2020, Hiura’s BABIP placed him 104th among qualified batters.
Among players who meet those standards, Hiura was second only to Bryan Reynolds in largest BABIP decline from 2019 to 2020. But what does that mean? It means Hiura was extremely lucky in 2019, and not so much in 2020.
When looking at Hiura’s metrics provided by Statcast, it also shows Hiura had less hard hit balls in 2020 than in 2019. In 2019, his Hard Hit% (Balls with an EV > 95 MPH) was 48.1%, however that fell to 39.6% in 2020.
That decline dropped Hiura from the 94th percentile all the way down to the 50th percentile.
Perhaps one of the few areas where Keston Hiura improved was his Barrel percentage. In 2019, he barreled 12.5% of time, in 2020 he upped that to 14.2%. In 2019, Hiura was in the 92nd percentile, and in 2020 he was in the 91st percentile.
Hiura struck out more in 2020 than in 2019. He went from striking out 30.7% of the time, to a whopping 34.6% of the time, that was fifth most among qualified hitters in 2020.
Another place of decline was Hiura’s exit velocity. His average exit velocity declined from 91.4 MPH in 2019, to 87.4 MPH in 2020. That placed him in the 89th percentile in 2019, all the way down to the 26th percentile in 2020. His lost velocity was the 4th largest decline in average exit velocity among players with 300 PA in 2019, and who qualified in 2020.
The decline in Hiura’s expected statistics comes from this decline in exit velocity. One of the key components of those statistics is Exit Velocity. That impacts xSLG, xBA, and also xISO, and other xStats.
Moving back to more tangible statistics, Hiura’s weighted On-Base Average (wOBA) saw a decline from .388 to .304. He also made less contact on pitches in the zone in 2020, going from 74.6% to 64.4%.
The offensive numbers show a clear regression, however, Hiura continues to barrel the ball, which indicates he can bounceback.
What about Defense?
Another major consideration going forward is Hiura’s defense. There has been speculation that a move to first base could be in the cards for Hiura. His defense continues to need improvement. In 2020, his Total Defensive Runs Saved Above Average (DRS) was -8 in 406 innings at second base. His Ultimate Zone Rating (UZR) was -4.0.
The relatively new Outs Above Average (OAA) also placed Hiura in the negatives. He had -2 OAA in 2020.
Throughout his career, Hiura has played 130 games at second base, which is a reasonable estimate for what he would play in a typical 162 game season, especially the way Craig Counsell manages. In that time, he has a DRS of -13, a UZR of -12.2, and a -11 OAA.
While defense is not everything, it is an added bonus to have a good fielding second baseman, a bonus that hopefully Hiura will be able to provide.
2020 was a weird season. Multiple projections expect a relative bounceback in 2021. ZiPS projects Hiura to slash (.246/.318/.460) with 28 Home Runs and to be worth 1.8 fWAR.
Depth Charts and Steamer have similar results for Hiura. Both have him slashing (.255/.323/.474) with Depth Charts projecting 31 home runs, and Steamer projecting 30. Depth Charts also project 1.8 fWAR for Hiura, and Steamer projects 1.7 fWAR.
That is not a bad season at all, however, for a prospect hailed as highly as Hiura was, it may be a slight disappointment.
With Ryan Braun seemingly having played his final game in Milwaukee, Hiura is now the bat backing up Yelich in the lineup. In order for the Brewers lineup to live up to its potential, Hiura will have to be more like his 2019 self than 2020.
