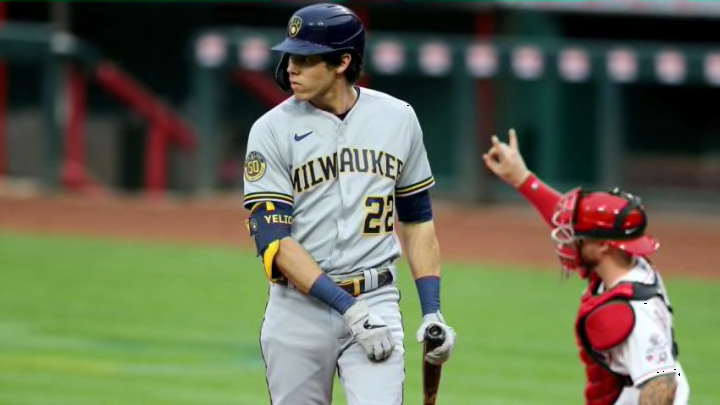
Critics of modern baseball often cite the emergence of Three True Outcome Hitters as one of the biggest issues with the game. Those outcomes are home runs, strikeouts, or walks, and are the only outcomes that are not influenced by defense at all. Baseball analytics have shown home runs to be the most efficient scoring method and lead to more success, and they view strikeouts as a side effect of the home runs.
What can the three true outcomes tell us about the Brewers since David Stearns took over? Have those percentages put the Brewers in a position to succeed, relative to the rest of the league?
Strikeout Percentage
The Brewers strike out more than the league average in the David Stearns’ era. In the five seasons that have passed since David Stearns took control of Baseball Operations, the Brewers total K% is 24.96%. The league average for that stretch was 22.12%. Of course, with big boppers such as Chris Carter, Eric Thames, Domingo Santana, and Keston Hiura on the team, that will elevate strikeout numbers.
While the league wide strikeout percentage has increased at a near steady percentage, the Brewers’ team specific rate has been much more variable. The Brewers saw a nearly 20% drop off from 2017 to 2018 before seeing dramatic increases.
As a team going through a rebuild, which the Brewers did, there was significant roster turnover, which may help explain the fluctuations in the team’s K%
Keen observers will notice that ‘17-‘18 is the offseason when the Brewers swapped out Keon Broxton and Domingo Santana for Lorenzo Cain and Christian Yelich in the starting lineup. The two seasons after that, the Brewers continued to see an increase in strikeouts, up to 24.8% in 2019 and 26.6% in 2020, which was the highest the club has had in the Stearns Era.
In 2019, even as strikeouts increased across the league, the Brewers outpaced those increases.
The struggles of Travis Shaw and the addition of Keston Hiura to the starting lineup brought more strikeouts. Even Yasmani Grandal struck out at a higher rate than Manny Pina did in his season in Milwaukee. Most people would correctly argue that Grandal and Hiura were net positives to the 2019 lineup, however, with that came the trade off of more strikeouts.
The team struggles in 2020 also brought on more strikeouts. Keston Hiura struck out more than ⅓ of the times he came to the plate. Christian Yelich also saw his K% balloon from 20% to 30%.
As strikeouts come, based on the data from the past five seasons, they are rising across all of baseball. The Brewers finished the 2020 season with the 3rd highest team K%, behind only the Tigers and the Rays. The AL Pennant winner, and the rebuilding Tigers having the top 2 spots shows all that needs to be said about strikeout %: It is not an indicator of success in the regular season.
When plotting out team’s strikeout percentage relative to their winning percentage over the past five seasons, there is a very slight negative association, which may indicate teams that strikeout less win more, but the R^2, which measures how closely the dependent variable (winning %) is predicted by the independent variable (strikeout %) is .078. That is nowhere near a point that is statistically significant in regards to predicting success.
The Los Angeles Dodgers, eventual 2020 World Series winners, struck out only 20.3% of the time, well below the league average. In the past five seasons, the only time the World Series champion was not among the lowest 5 teams in K% was the 2016 Chicago Cubs.
The Brewers have consistently been towards the top of the K% over the past five seasons, leading the league in 2016 and 2017. While the Rays were able to make a World Series run while striking out often, teams that have managed to make it to the World Series have struck out more towards the lower end of the spectrum than the Brewers have been.
So far, it appears that teams that manage to limit the least desirable of the three true outcomes may have the most playoff success, a lower strikeout % is not indicative of regular season success. Given the make up of the roster, limiting strikeouts may be an issue for the Brewers, which may continue to hinder their postseason success.
