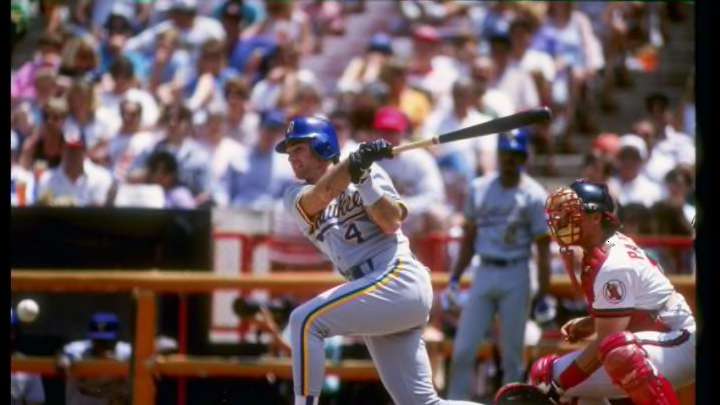
Both of the 1980 and 2017 Milwaukee Brewers concluded their seasons with 86-76 records. However, one of these squads left Brewers fans pleasantly surprised, while the other was more of a disappointment. With this in mind, how similar were the 2017 and 1980 Brewers?
Most people expected 2017 to be just another year in the rebuild. Expectations were low, and few predicted the Milwaukee Brewers to be anything better than a fourth-place finisher in the NL Central. Expectations changed following a monster month of April from off season acquisition Eric Thames, propelling the team to a 13-13 record to finish the first month of the season.
On the other hand, 1980 was a year of hope for the Brewers. In 1979, the team had the second-best record in the American League. Sadly, the division-rival Baltimore Orioles held the best record in the league, making Milwaukee a mere afterthought. After a 95-66 record the year before, a rough 7-8 start to the season didn’t bode well for the Cream City.
2017 vs. 1980: Offense
As is the case with many Brewers teams in recent memory, home runs fueled the 2017 team. As a team, Milwaukee led the National League with 224 home runs. The Brewers got help from a number of sources, but a trio of sluggers carried much of the weight over the course of the season. Thames, Travis Shaw and Domingo Santana all reached the 30 home run plateau. Keon Broxton also added 20 more, with a number of others reaching double digits.
In a similar vein, the 1980 Brewers also led their league in home runs, seemingly a precursor to Harvey’s Wallbangers. Milwaukee smacked 203 home runs, with the two-headed monster of Ben Oglivie and Gorman Thomas leading the way. Oglivie paced the crowd with 41 homers, while Thomas followed right behind with 38 of his own. Two others also reached the 20-homer mark, with Cecil Cooper bashing 25 and a 24-year-old Robin Yount ripping 23.
Batting average was a secondary thought for the 2017 squad, as no one batted above .280. Interestingly, Manny Pina was the team batting champion with a .279 average, followed closely by Santana, Orlando Arcia and Brett Phillips. Thames and Shaw were batting above .300 for a good portion of the season, but they wound up dipping to .250 and .273, respectively.
The 1980 Brewers actually had a decent team batting average, sporting a .275 mark at season’s end. Three players batted above .300 over the season, including a whopping .352 average from Cooper. Oglivie and 23-year-old Paul Molitor both batted .304 behind him.
One final similarity between the two teams is how speed played into their games. The 2017 crew led the league with 128 stolen bases. Jonathan Villar and Broxton both eclipsed 20 steals, but five others also reached double digits. The 1980 Brewers had a very similar distribution of thefts when they stole 131 bags. The only difference was one fewer double-digit base stealer, but a 34-steal effort from Molitor overcame that issue.
2017 vs. 1980: Pitching
Junior Guerra toed the rubber on Opening Day this past season, but he was largely a non-factor the rest of the season. The three top starters for the Brewers wound up being Jimmy Nelson, Zach Davies and Chase Anderson. Nelson took a huge step forward in 2017, striking out well over a batter per inning while producing the best FIP (3.05) among the team’s starters. Davies and Anderson also impressed, with the former leading the team with 17 victories and the latter sporting a strong 2.74 ERA by season’s end.
Back in 1980, Jim Slaton got the Opening Day assignment and responded with an 8 1/3 inning effort (opposite Dennis Eckersley of the Red Sox!). He wound up making just three starts all year, though. As a result, the team relied on veteran Mike Caldwell (13-11, 4.03 ERA) and 24-year-olds Moose Haas (16-15, 3.10 ERA) and Lary Sorensen (12-10, 3.68 ERA). They were all serviceable, but the most interesting thing about their respective years is the number of complete games. Haas and Caldwell both tallied more than 10 complete games, while Sorensen added eight to the total. It came at the detriment of their strikeout rates, but their records show this approach had some success.
By the end of the 2017 campaign, the bullpen was a source of strength for the Brewers. Closer Corey Knebel became an All Star by tallying 39 saves while posting a 14.9 K/9. Prospect Josh Hader and mid-season acquisition Anthony Swarzak further anchored the back end of the ‘pen. Those two both finished the season with ERA’s below 2.50 and strikeout rates north of 12 whiffs per nine.
The 1980 Milwaukee Brewers bullpen differed greatly, likely a result of the different game that was played then. The main relief contributors were lefty Bob McClure and righty Bill Castro. McClure led the team in saves with 10, but he also made five starts (with two complete games) to finish with a 3.08 ERA. Castro made all his 56 appearances in relief and produced a team-leading 2.77 ERA in that role.
Next: Which other seasons were similar to 2017?
As far as statistics go, these two teams were fairly similar. Especially on the hitting side, it seems like there were similar approaches at the plate and on the base paths. However, the pitching was fairly different, although that can likely be attributed to differences in the era of the game. Surprisingly, both squads produced nearly identical records in the final month of the season. However, given the context of the season before and the expectations heading into the season, many people see 2017 as the more successful season of the two.
