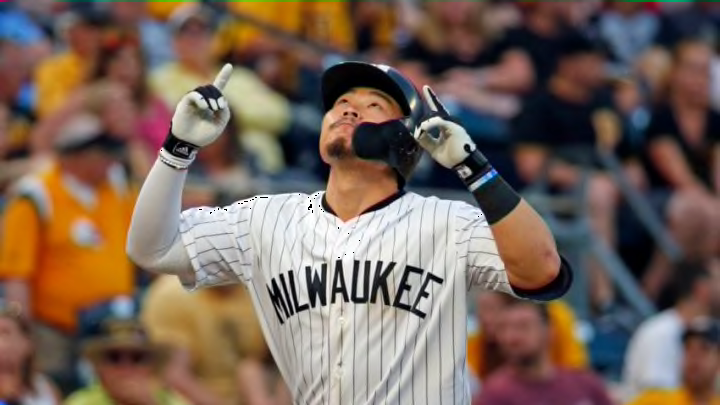
Keston Hiura made his Major League debut with the Milwaukee Brewers on May 14, 2019. He played well in his initial cup of coffee, but was sent back down after a few weeks. He returned to the team at the end of June and had a great rookie season. Can we expect more of the same in Hiura’s sophomore season or will he slump?
Often times when a rookie has a successful season they regress by some standard in their second season. It may be due to the league adjusting, an analytical regression to the mean, or a combination of the two. Let’s start with the analytics of Keston Hiura‘s rookie season.
Two stats I want to focus on for Hiura are BABIP (batting average on balls in play) and ISO (essentially a batters raw power numbers).
Why look at Hiura’s BABIP?
BABIP certainly has a luck factor to it, but additional factors, such as hard hit percentage and exit velocity, play a role. Hiura’s numbers were extremely good in those departments, but sometimes a player simply gets lucky. In 2019, the league average BABIP was .298. With this stat, good hitters are typically in the .350 range. For example, Brewers superstar Christian Yelich‘s BABIP in 2019 was .355. However, Hiura’s BABIP was .402!
That number is off the charts crazy and certainly not sustainable over an entire season. One thing Hiura does have in his favor was that his average exit velocity was well above league average last season at 91.4 MPH. Hard hit balls may result in more base hits, unless of course a player has an “unlucky season” in the BABIP department.
Why look at Hiura’s ISO?
ISO is essentially a metric that measures a batters raw power numbers. In fact, the formula is slugging percentage minus batting average, so that means the result measures how many extra bases a player averages per at bat. Last season, Hiura had an ISO of .268 and league average was .183. A big factor in his high ISO last season was certainly due to his 19 home runs and 23 doubles in just over 300 at bats.
Could Hiura regress in 2020
Given his BABIP and ISO numbers I would expect a regression to the mean during his sophomore season. The question is what is average for Hiura? Is it closer to league average or still well above?
Another factor that goes into sophomore slumps is the league adjusting. Hiura had insanely high whiff percentages in his rookie season, by far his biggest offensive downfall. Part of this is due to his aggressive approach at the plate.
When his whiff percentages are broken down by pitch selection it shows Hiura whiffed on 31% of fastballs, 49% of breaking pitches, and 45% of off speed pitches. These are dangerously high numbers. One could argue that he struggles to make contact with breaking balls the most, but even his fast ball whiff percentage is super high. I don’t think the league will adjust by simply throwing Hiura primarily breaking balls because when he does hit them, they can go a long way.
These percentage can also be broken down by location. According to BrooksBaseball.net, Hiura whiffed more on elevated pitches as compared to any other location. He did not whiff a lot on inside or outside pitches. Interestingly his whiff percentages increased lower in the zone as well, just not to the magnitude of high pitches. Based off this data, it appears one strategy when pitching to Hiura would be change location vertically, rather than horizontally.
In the end, it is hard to imagine Hiura repeating some very impressive offensive analytic numbers for the Brewers in 2020, but that does not mean he will fall a victim of the sophomore slump. There are flaws to his already impressive offensive game, but the hope is that Hiura realized them over the off season and will beat the league to the adjustments!
