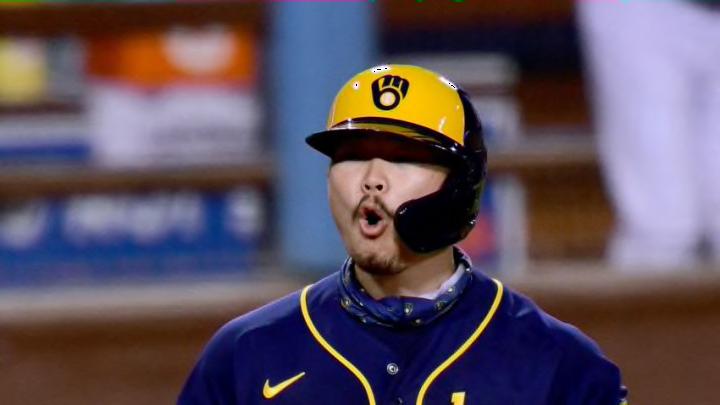
Keston Hiura had some highs and a lot of lows in his sophomore season with the Brewers.
In January of 2020 I wrote an article regarding two metrics I would be watching during the 2020 season to see if Keston Hiura could avoid the sophomore slump. Now that the Brewers season is over, it’s time to evaluate those metrics and his season in general.
Batting Average on Balls In Play (BABIP)
The first metric I talked about in January was BABIP. In 2019, Hiura had a .402 BABIP that we knew was going to be unsustainable. The question was how far down would this number regress?
For reference, good major league hitters have a BABIP around .350. In 2019, Christian Yelich had a .355 BABIP and the league average was .298.
In 2020, Hiura’s BABIP decreased to .273.
This decrease was much more than I was anticipating seeing how Hiura made a ton of loud and hard contact throughout his rookie season with the Brewers.
There are a few explanations for his drop in BABIP in 2020. First off, his exit velocity decreased to an average of 87 MPH in 2020, which is four ticks slower than 2019. Secondly, he hit the ball on the ground more often in 2020 and when you combine that with the decreased exit velocity, it makes sense why his BABIP was lower.
How much more was he hitting the ball on the ground this season? His ground ball rate went from 37% in 2019 to 44% in 2020, a seven percent increase. Additionally, he also pulled the ball a lot more in 2020 with a nine percent increase there. The increased pull also meant he used the opposite field less as well, which may indicate that Hiura was pressing too much at the plate given the Brewers were relying on him for production and the rest of the offense was essentially non-existent.
Isolated Power (ISO)
The second metric I mentioned in January was ISO. ISO is a metric that is calculated by taking a batter’s slugging percentage minus batting average. The end result is how many extra bases a player averages per at bat.
In 2019, Hiura had an ISO of .268 with the league average being .183.
In 2020, Hiura’s ISO decreased to .198.
At first glance, this is encouraging that his ISO numbers did not drop completely off the table and he still was above the 2019 league average.
What were some key factors that contributed to Hiura’s high 2019 ISO? Well, he had 19 home runs and 23 doubles in just over 300 at bats. In 2020, his .198 ISO was comprised of 13 home runs and just four doubles in slightly more than 200 at bats. The four doubles is the number that stands out to me the most here.
As mentioned above, Keston Hiura did not hit the ball into the air as much in 2020, but to see that big a drop off in doubles is concerning. When hitting the baseball into the air in 2020 his fly ball batting average was just .205. This is terrible compared to his .357 fly ball batting average in 2019. I think this can all be related to the fact he made a lot weaker contact in 2020, had a decreased exit velocity, and balls just failed to get into the gaps as a result.
What does this all mean going forward?
While it is nice to finally have some numbers to compare from season to season regarding Keston Hiura, I think this 2020 season showed that he still has lots of work to do. One area that often gets talked about with Hiura is strikeouts
I do think it is important to remember that prior to playing at the major league level, we knew Keston Hiura was a high strikeout player, but his inability to hit the fastball this season was the most concerning to me. It is even more concerning when you factor in that he does most of his damage versus the fastball as well.
For instance, in 2019 Hiura hit 11 of his 19 home runs off of the fastball. Compared to breaking and off speed pitches, the fastball was the pitch he whiffed on the least at 30%. In 2020, he hit nine of his 13 home runs off the fastball but his whiff percentage increased to 41.5%. That increased percentage of swings and misses resulted in a lot of missed chances for the Brewers slugger to be productive at the plate and drive in runs.
To be an efficient fastball hitter, you have to be able to either A) lay off high fastballs or B) do damage with ones that miss the top of the zone. Hiura failed to do both of those things in 2020 and that is something he needs to figure out prior to the 2021 season otherwise he will find himself on top of the National League Leaders in strikeouts again.
The Brewers are going to be depending on Hiura in the middle of the lineup once again next year. For the sake of the offense, they need him to get it going.
